
Las Vegas multifamily rent pressures persist despite leasing gains
Q3 2026

Download the full Q3 2026 Las Vegas multifamily market report here.
Highlights
- Las Vegas multifamily operating conditions remain soft, with elevated vacancy, rising concessions and declining rents. Net absorption has exceeded deliveries in 2026, but the improved supply-demand balance has yet to translate into rent growth.
- Stabilized vacancy reached 9.1% at the end of the third quarter, flat from the prior quarter but up 20 basis points from one year earlier. Vacancy remains 30 basis points below the year-end 2025 rate.
- Asking rents averaged $1,479 per month by the end of September, down 1.4% year over year and 0.9% lower than in the prior quarter, the second consecutive quarterly decline.
- Investment sales volume during the third quarter totaled roughly $209 million across five deals, with Class B properties accounting for four of the five deals. The year-to-date median sale price reached $225,900 per unit.
Las Vegas multifamily market overview
Las Vegas multifamily fundamentals remain under pressure despite improved absorption and a slowdown in new deliveries in 2026. Net absorption has exceeded deliveries by roughly 650 units year to date, after trailing them by nearly 1,700 units in 2025. Absorption has already surpassed the full-year 2025 total, supported by continued job growth, while completions have slowed as fewer projects remain under construction. The recovery has been concentrated in the suburbs, where Summerlin/Spring Valley, Henderson and Enterprise/South Paradise captured more than two-thirds of that demand with less than half of the metro’s inventory. Rent growth has been slower to rebound. Asking rents remain below year-ago levels, with the steepest declines in older urban core submarkets, where vacancy is above 10%. By contrast, rents in suburban submarkets remain close to year-ago levels.
Investment activity in 2026 has become concentrated in two of the suburban submarkets that are leading the leasing recovery. Summerlin/Spring Valley and Henderson accounted for roughly three-quarters of metro sales volume through the third quarter, up from 43% in 2025. Third-quarter activity followed the same pattern, with three of the five trades located in those two submarkets. Pricing has remained stable in Summerlin/Spring Valley and Henderson, with median sale prices near $250,000 per unit in both submarkets, above levels elsewhere in the metro, where recent trades have skewed toward smaller, older properties. The median price across the Las Vegas region has remained near its 2025 level, highlighting the influence of property location on pricing trends.
Employment:
Area employers added 21,400 jobs year over year.
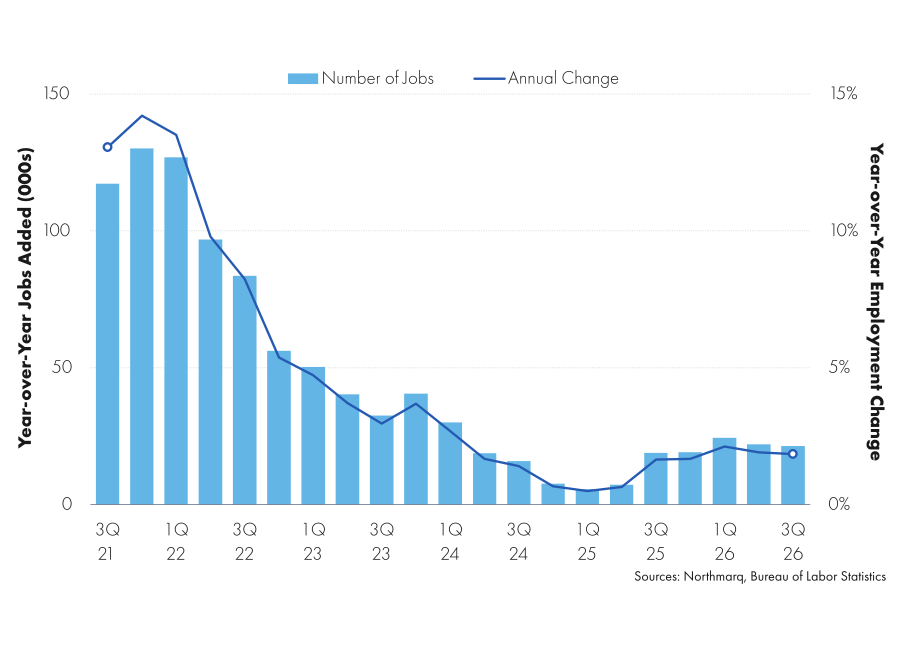
- Area payrolls increased by 21,400 jobs year over year as of the third quarter of 2026, a gain of 1.8%. Hiring slowed from the first half of the year and held below the 10-year average annual growth rate of 2.4%.
- Professional and business services remained the leading source of new jobs, adding 10,900 positions and expanding 6.3% year over year. Education and health services added 5,400 jobs, while leisure and hospitality, the largest local employment sector, shed 2,200 positions, a 0.7% decline.
- Hyve Solutions, a manufacturer of storage and AI computing hardware, is establishing a new production facility in North Las Vegas. The project, the largest of four business expansions approved for state tax incentives in August, is expected to create 240 jobs over the next two years.
- Forecast: Employers are forecast to add roughly 20,000 jobs in 2026, a 1.7% increase, maintaining a pace similar to 2025.
Development and permitting:
Developers completed roughly 600 units in the third quarter.
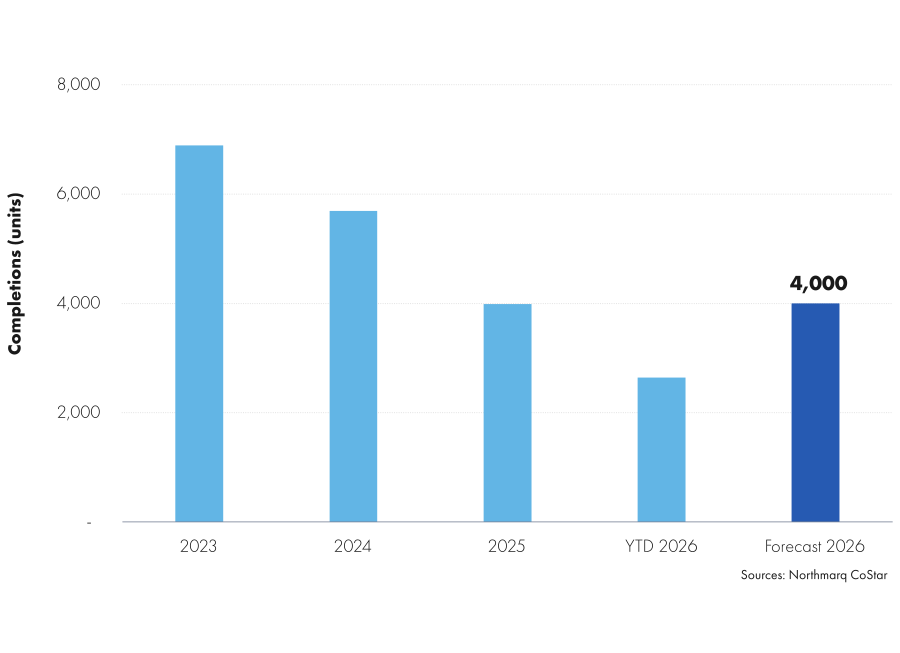
- Developers completed roughly 600 units in the third quarter, all in Central Las Vegas. Year-to-date deliveries total around 2,600 units, down 23% from the same period in 2025.
- Roughly 6,100 units were under construction at the end of the third quarter, down more than 25% from the end of 2025, which is expected to ease supply pressure on operators heading into 2027. Six active projects in Spring Valley total more than 2,000 units.
- Multifamily permitting activity is regaining momentum. Developers pulled permits for 1,130 multifamily units in the third quarter, more than double the total from one year earlier.
- Forecast: Developers are expected to complete roughly 4,000 units in 2026, in line with both the 2025 total and the 10-year average.
Vacancy:
Vacancy ended the third quarter at 9.1%
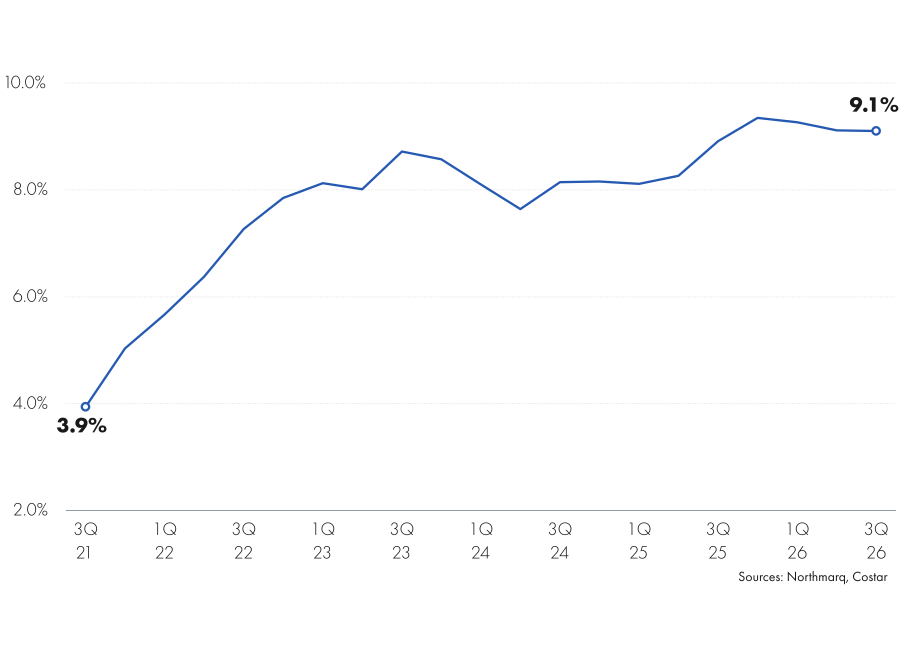
- Stabilized vacancy ended the third quarter at 9.1%, up 20 basis points year over year. Despite the annual increase, net absorption has exceeded deliveries in 2026, pushing vacancy down 30 basis points from year-end 2025.
- Class B properties account for roughly 70% of net absorption this year, with vacancy flat year over year at 9.0%. Class A vacancy edged up to 8.4%, while Class C, the only tier with negative net absorption in 2026, posted the highest vacancy at 10.0%.
- Suburban submarkets continue to pull away from the urban core. Summerlin/Spring Valley, Henderson and Enterprise/South Paradise captured more than two-thirds of net absorption this year, each with vacancy below 7.5%. Las Vegas Strip vacancy rose 170 basis points year over year to 12.1%.
- Forecast: Vacancy is expected to tick up 20 basis points to 9.3% by year-end 2026, though it would remain 10 basis points below the year-end 2025 rate.
Rents:
Asking rents averaged $1,479 per month.
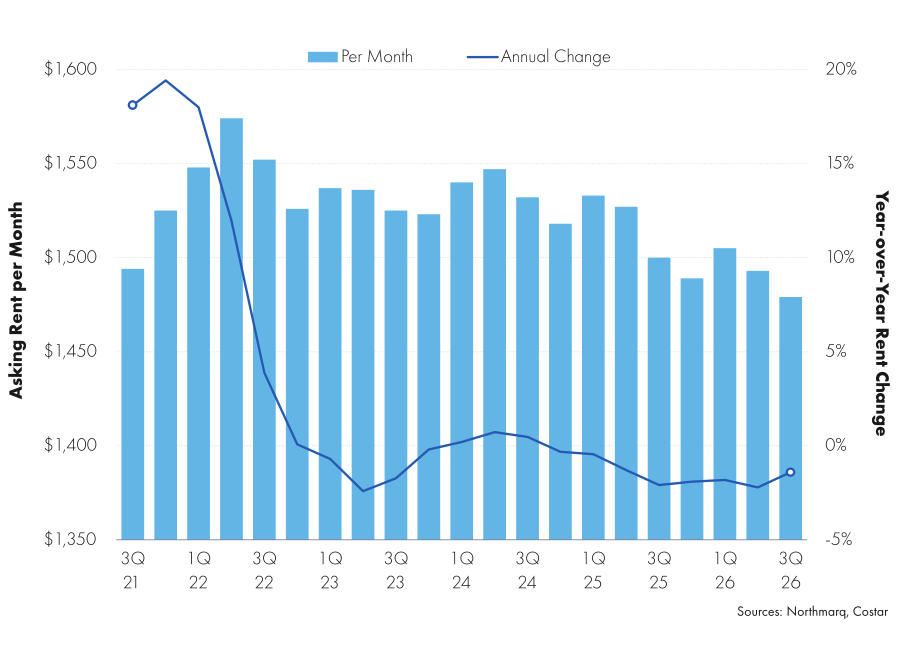
- Asking rents averaged $1,479 per month in the third quarter, down 0.9% from the prior quarter and 1.4% year over year. Rents have declined for two consecutive quarters, erasing the gain recorded at the start of the year.
- Rent performance varied across submarkets. Henderson posted a modest 1.0% year-over-year rise to $1,580 per month, while rents declined in each submarket with vacancy rates above 10%, including a 5.0% annual drop on the Las Vegas Strip.
- Class A was the only tier to post annual rent growth, up 0.7% to $1,772 per month. Class B, the largest tier by unit count, recorded the steepest decline at 2.2%, while Class C rents fell 1.3%.
- Forecast: Asking rents are forecast to end the year at $1,460 per month, a 1.9% decline from 2025 that would extend annual rent losses to a fifth consecutive year.
Multifamily sales:
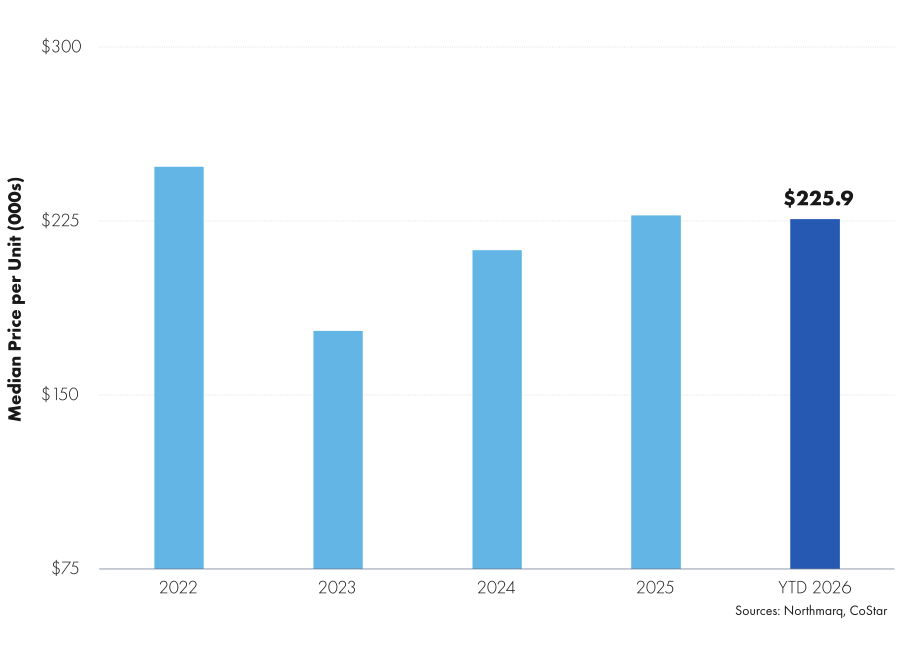
The median sale price reached $225,900 per unit.
- Sales activity eased from the second quarter but remained more than double the first-quarter total, with five properties trading for roughly $209 million. Year-to-date volume reached about $562 million, approximately half the amount recorded during the same period in 2025.
- The deal mix shifted in the third quarter. After newer Class A communities led second-quarter sales, Class B properties built between 1992 and 2013 accounted for four of the five trades, including the largest transaction of the quarter.
- The year-to-date median sale price reached $225,900 per unit, nearly identical to the 2025 figure. Third-quarter Class B trades sold for roughly $190,000 per unit to $250,000 per unit, a range that bracketed the metro median.
- Reported cap rates on third-quarter transactions ranged from 5.2% to 5.6% and averaged roughly 5.4%, in line with the 2025 average of 5.3%. All three reported yields came from Class B properties.
Looking ahead for Las Vegas:
Las Vegas multifamily fundamentals are expected to soften slightly through the end of 2026 before improving in 2027. A heavier slate of fourth-quarter deliveries is likely to push vacancy up from current levels and extend average asking rent declines through year-end. Beyond that, the balance should favor renter demand. Net absorption is running ahead of the 2025 pace, and fewer units are under construction than at the start of the year, positioning occupancy gains to carry into 2027. Rent growth is likely to return first in Summerlin/Spring Valley, Henderson and Enterprise/South Paradise, where vacancy is near 7% and rents have already stabilized. The urban core and Class C properties face a slower recovery, particularly if leisure and hospitality employment continues to struggle to add workers.
Investment activity is expected to remain concentrated in Summerlin/Spring Valley and Henderson through the end of 2026, where low vacancy and stable rents have supported pricing. With cap rates near the 2025 average and per-unit values in those submarkets steady, valuations are unlikely to shift materially in the near term. A broader recovery in sales volume will depend on rent growth returning across more of the metro. As occupancy gains carry into 2027 and new supply slows, additional submarkets should begin to post the stable operating performance now concentrated in the suburbs, supporting transactions across a wider range of locations and asset classes. Until then, sales in the urban core and among Class C properties are likely to remain limited, keeping the metro median sale price closely tied to where suburban deals close.
Connect with our Las Vegas team today
For a complete analysis of supply, demand, vacancy, rent and investment trends in the Las Vegas multifamily market, download and read the full report below. Subscribe to receive the latest multifamily market insights and research.
The Northmarq Las Vegas office provides a broad range of commercial real estate solutions across debt, equity and investment sales. Engage with our Las Vegas team today.
Get the Q3 2026 Las Vegas report


Insights
Research to help you make knowledgeable investment decisions