
2026 midyear national multifamily report: Property fundamentals improving, but investment activity struggles to gain momentum
Download the full Northmarq 2026 Midyear Multifamily Outlook here.
Key Takeaways:
- The national multifamily market posted better-than-expected property performance during the first half of 2026.
- The pace of new construction has slowed, limiting supply-side pressures, while renter demand for units has remained elevated, fueling net absorption.
- The U.S. average vacancy rate dipped 20 basis points in the first half of 2026 to 5.7%, while rents ticked higher.
- While multifamily property performance has improved, rising interest rates have dragged on the capital markets.
- Multifamily cap rates averaged 5.75% in the first half of 2026.
2026 midyear national multifamily overview
At the beginning of 2026, there was a level of optimism surrounding the national outlook for multifamily properties. The pace of new deliveries was cooling and construction starts were slowing, suggesting that the supply-side pressures that had dragged on property performance in recent years would be easing. Fundamentals were not expected to completely rebound in 2026, but they were expected to stabilize, setting the stage for the market to gain momentum beginning in 2027.
The outlook for the capital markets was also positive. Interest rate cuts seemed like a likely outcome, supported by a cooling rate of inflation and a more accommodative Federal Reserve. Lenders were offering competitive terms and investment activity had gained momentum in the quarters leading up to this year.
Through the first half of this year, some of the actual property performance has met or even exceeded expectations. Net absorption has remained strong enough to push the national vacancy rate lower and allow for modest rent increases.
While fundamentals are improving, the capital markets have proven to be more challenging than originally forecast. Interest rates have risen, slowing the momentum in the transaction markets.
All these factors are taken under consideration in the Northmarq 2026 Midyear National Multifamily Outlook that evaluates the current state of the national multifamily market and shape our outlook for the rest of 2026 and into 2027.
“Multifamily property fundamentals have strengthened to this point in 2026, sparked by an environment where renter demand for units remains elevated and the pace of supply growth is slowing. These trends shape the Northmarq outlook for the remainder of 2026 and into 2027.” Pete O’Neil National Director, Research, Northmarq
Economy:
Employers are adding workers at a faster pace in 2026 than they did in 2025. According to the Bureau of Labor Statistics, 460,000 jobs were added during the first half of 2026, compared to fewer than 120,000 jobs in all of last year. The private sector has led the way, while government jobs have acted as a drag on overall growth.
Supply & Demand:
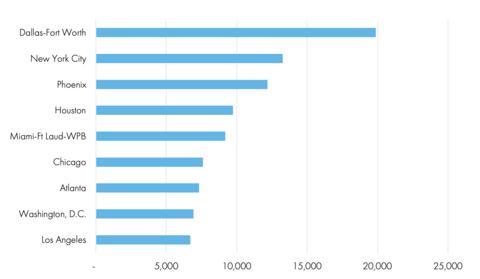
During the first half, developers delivered approximately 150,000 multifamily units, while net absorption totaled nearly 225,000 units. Approximately 300,000 units of new inventory are expected to come online this year, down from roughly 430,000 units in 2025. Net absorption was strongest in Dallas-Fort Worth, New York City and Phoenix.
Net Absorption: Top Markets
Net Absorption First Half of 2026 (Units)
Vacancy & Rent:
The national average vacancy rate ended the second quarter at 5.7%, down 20 basis points for the first half of the year. Rents gained ground; the U.S. average rent increased 1.2% in the first half, with the strongest increases occurring in the second quarter. The San Francisco Bay Area and New York City were the leading markets for rent growth.
Investment Sales:
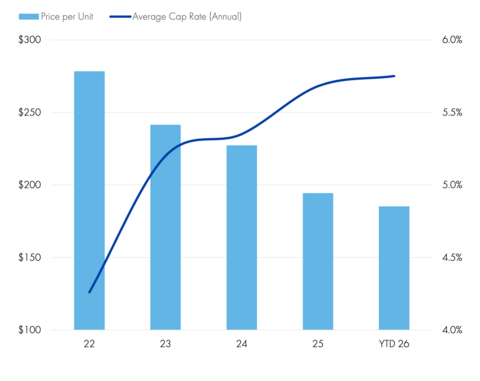
Investment activity is ahead of the 2025 pace by 8%, although momentum showed signs of leveling off from the first quarter to the second quarter. Prices have crept lower. The median price in the first half was $185,200 per unit, while cap rates averaged 5.75%.
Price and Cap Rate Trends
Median Price Per Unit (00s) & Average Cap Rate (Percentage)
Debt & Equity:
The debt and equity markets began the year with elevated origination volumes, although conditions cooled as interest rates pushed higher beginning in the second quarter. Freddie Mac posted $31.2 billion in new business origination in the first half, while Fannie Mae reached its highest first-quarter levels in five years before the pace slowed in the second quarter.
Outlook:
Multifamily properties outperformed expectations in the first half of this year, allowing for a slight recalibration of forecasts for the remainder of the year. Vacancies will likely tick lower by another 10 or 20 basis points, and rents are expected to advance slightly.
Much of the capital markets outlook for the remainder of this year will be driven by the interest rate climate. Rates have pushed higher in recent months and there are varied forecasts about the Federal Reserve’s next steps.
Get the 2026 national multifamily outlook

Insights
Research to help you make knowledgeable investment decisions