The main ingredient: Interest rates and commercial real estate
Northmarq Fund Management Research

Commercial real estate cycles can be heavily influenced by changes in interest rates. Interest rates in turn are determined by Federal Reserve policy, legislative or executive action, and market forces.
Given that the Federal Open Market Committee raised the benchmark Fed Funds Rate (FFR) by more than 525 basis points between March 2022 and July 2023, what can we expect for commercial real estate now that the Fed has reduced the FFR by 100 basis points over the last 3 months of 2024? What do we make of the market’s initial reaction of increasing Treasury rates by 100 basis points in response?
During the recent hiking cycle, the Fed hiked the Funds Rate 11 times, pushing the benchmark rate from effectively 0% in March 2022 to a range of 5.25% to 5.5% reached in July 2023. The >500bps series of rate increases was the most restrictive since the 1,000-basis point increase over a six-month period need to quell inflation in 1980-1981. This recent 2024 peak persisted until the Fed finally reversed course with a 50-basis point cut in September, followed by another 25bps in both November and December.
Commercial Real Estate is inherently a leveraged asset class, due to the sheer amount of money needed to purchase and operate commercial properties. Unlike stocks or bonds which can be acquired in small units, commercial properties tend to be paid for in lumpy amounts of debt and equity (other than in syndicated/securitized structures). As a leveraged asset class, commercial real estate returns are highly sensitive to the spread between unleveraged net income yields (cap rates) and the cost of borrowing (mortgage rates).
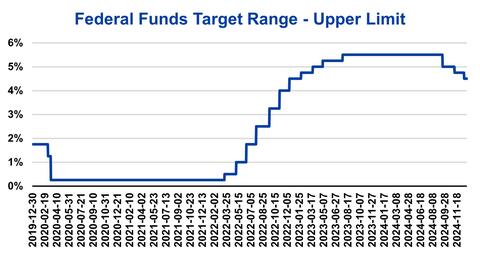
Source: Federal Reserve Board
Short Rates and Long Rates
For the most part, the Fed has more control over the short-end of the yield curve than it does over longer-dated interest rates. Exceptions occur in certain crisis periods when the Fed purchases longer-dated securities to support prices and drive down yields. Commercial real estate borrowers utilizing shorter-term, floating-rate loans may experience immediate pain during periods of rising interest rates, and more instant relief as the Fed begins a cycle of rate reductions. For example, this situation is common for many apartment syndicators active in recent years, and interest rate movements on short-term bridge loans will have a profound effect on return outcomes. Rate floors and caps can place some boundaries around these effects for floating rate borrowers and lenders. On the other hand, fixed-rate borrowers without near-term loan maturities may not be impacted by these adjustments in the same way or at the same time. Said simply, Fed actions have more immediate effects on the short end of the curve, quickly impacting floating rate loans, whereas broader market forces may play a larger and more gradual role in determining a sustainable level of cap rates and debt service coverage ratios for borrowers with longer-term, fixed-rate mortgages.
Timing Effect of Fed Funds Rate on CRE Values
Public Markets
The following chart shows movements in the Fed Funds Rate compared to changes in overall public REIT values. The Fed Funds Rate is managed by the FOMC to respond to expansionary or contractionary phases of the economy. As the economy heats up, the Fed implements a more restrictive policy and raises rates, and when the economy cools, the Fed lowers rates as the linchpin of an accommodative policy. Following a low in the Fed Funds Rate, prices are typically climbing, and following a peak in the FFR rate, values begin falling. On average, following an extended hiking cycle, the data indicates a delay of 13 months from the first cut in the Fed Funds Rate before REIT prices resume an extended growth cycle.
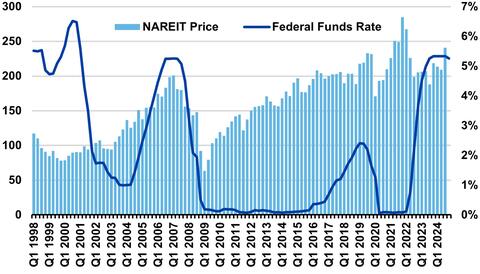
Source: NAREIT, Federal Reserve Board
Private Markets
Private market values are represented below in the form of the GreenStreet CPPI index, shown in comparison to the Fed Funds Rate. Here we can see the lag effect from changed interest rates on the implied private values of REIT assets, which take longer to filter through to actual property sales prices (20 months from first rate cut to a resumption of sustained growth in property values).
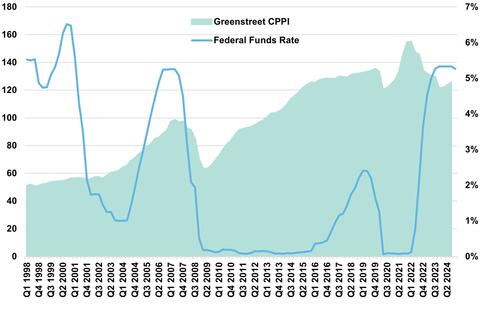
Source: Greenstreet, Federal Reserve Board
Timing Effect of Fed Funds Rate on Transaction Volume
A similar response to interest rates occurs for the transaction volume of commercial real estate. Summarizing transactions into annual data below helps highlight the relationship whereby transaction volumes track interest rates—significant rate cuts increase sales volume, whereas hiking cycles decrease transaction volume. In the most recent period, you can see that the magnitude and swift timing of the interest rate increases in 2022-2023 dramatically slowed purchase/sales volume.
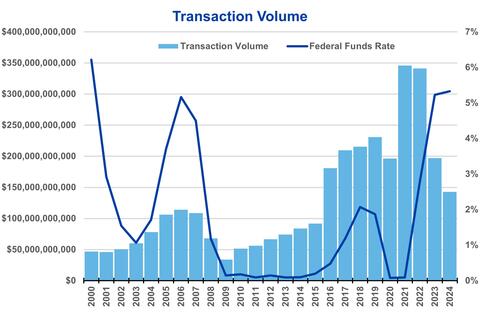
Source: Federal Reserve Board, TREPP
Interest Rates and Cap Rates
In addition to timing, we must compare the recent combined 100 basis point decreases in the Fed Funds Rate to the extreme 500-basis-point rate hike totals from 2022 – 2023 (5x the magnitude). Although the benefits of modest Fed cuts will begin filtering through the CRE sector in the form of new mortgages (particularly shorter-term borrowings), the effect should be smaller than the negative valuation effects of massive prior rate increases. That being said, and this is an important point, experienced real estate investors were broadly skeptical of the prior zero interest-rate environment and held cap rate spreads wider: i.e. – cap rates didn’t decrease point-by-point with the decreases in the Fed Funds Rate.
One way to look at CRE pricing is to compare the 10-year Treasury Rate to cap rates over time. Prior to 1991, cap rates were lower than the 10-year Treasury yield based on the notion (similar to public equities) that real estate has upside potential beyond that of government securities. Following 1991, however, investors decided they needed a yield premium to account for the illiquidity of commercial real estate. Since that inflection point, overall cap rates have averaged a 314-basis-point spread over the 10-year Treasury (varied of course by geography and product type). This spread covering 23 years varied greatly within smaller timeframes. The lowest spread of cap rates over 10-year USTs during the period was only 58bps in June 2007 and the highest spread reached 495bps in December 2009. Cap rate spreads in late 2019 were averaging 417 basis points until post-Covid monetary and fiscal stimulus spiked inflation and prompted the FOMC to dramatically increase the Fed Funds Rate (shown in the form of the Effective Fed Funds Rate in the chart below).
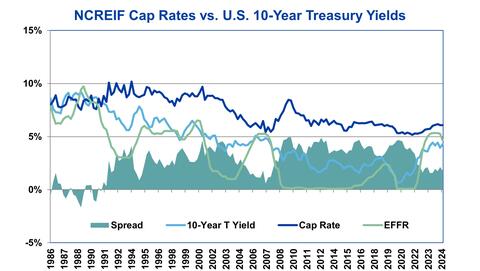
Source: U.S. Treasury, NCREIF
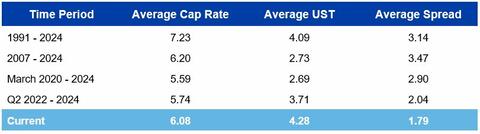
We can see above that the market averaged a 465-basis-point spread above 10-year Treasuries in September 2020, allowing a 151-basis-point cushion by which the Funds Rate could increase before reducing spreads below the historical post-1991 average of 314 basis points. However, without much of an increase in cap rates thus far, the spread is operating at less than average levels (179bps). Perhaps the market is assuming interest rates will drop and/or cap rates will increase.
Loan Origination Volumes
As should be expected, new mortgage originations tend to increase as interest rates drop, and slow when interest rates increase.
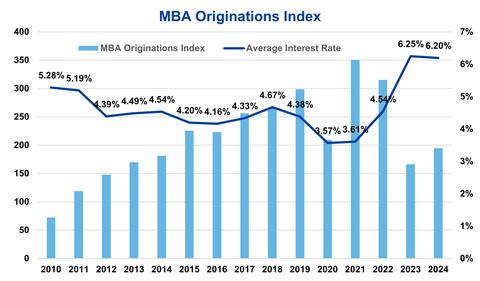
Source: MBA, U.S. Treasury, Northmarq
Timing of Loan Maturities
Given our estimate of approximately $1.2 trillion of commercial mortgage loans maturing over 2025 and 2026, borrowers with maturing loans (whether fixed or floating) will be comparing market interest rates to those at the time when their mortgages first originated. We estimate the average interest on these maturing loans to be 4.91% during 2025 and 4.59% during 2026, compared to today’s average interest rates above 6.0%.
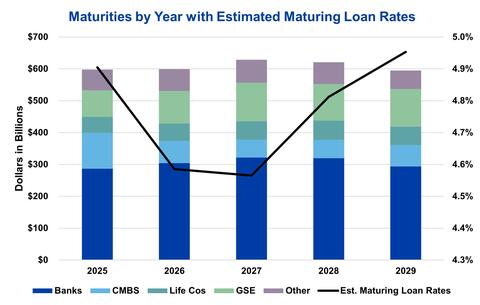
Note: Includes more than $250 billion of loans past originally scheduled maturity dates
Source: TREPP, Northmarq
Comparing interest rates in the mid-to-upper 4%’s (above) on expiring loans with new mortgage rates over 6.0% (below), many borrowers with mortgages taken out in prior lower rate years can expect some serious sticker shock on new mortgages issued in 2025 and 2026. It’s easy to imagine the immediate need for significant gap debt and equity capital to resolve upcoming mortgage maturities.
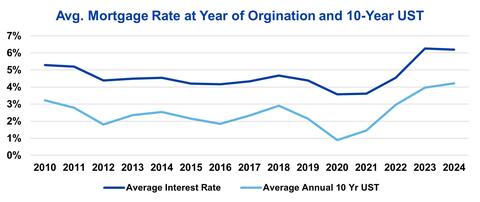
Source: U.S. Treasury, Northmarq
Interest Rates, Recessions and Real Estate
Historically, after rapid increases in the Fed Funds Rate, increased unemployment rates and recessions tend to follow (chart below). The current cycle has thus far proven to be an exception.
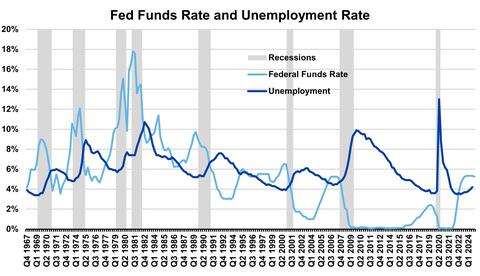
Source: Federal Reserve Board, US Bureau of Labor Statistics, National Bureau of Economic Research
In light of this historic pattern of rate hiking cycles leading to recessions, why do commercial real estate prices and volume typically increase 1 to 2 years following peaks in interest rates? In large part this is due to the Fed’s traditional cure for recessions – cutting interest rates to restart a slowing economy. Even in a weakened economy, lower interest rates aid real estate performance. In the case of this latest cycle, the Fed Funds Rate rose from 2016 to 2019, was already being lowered in mid-2019, and then Covid hit in 2020, forcing rates immediately back toward zero. The 2022-2023 hiking cycle designed to slow inflation hasn’t yet been enough of a headwind to send the economy back into recession. This delay or prevention of recession is most likely due to the sheer scale and lingering tailwind of $10 trillion of combined post-Covid fiscal and monetary stimulus.
©Northmarq Fund Management Research, February 2025. All Rights Reserved. Copying, selling or otherwise distributing copies and/or creating derivative works for commercial purposes is strictly prohibited. Although significant efforts have been made in preparing this paper, Northmarq Fund Management Research makes no representation or warranties with respect to the accuracy and completeness of the contents. Northmarq Fund Management Research does not provide tax, legal, investment or accounting advice. This material has been prepared for informational purposes only, and is not intended to provide, and should not be relied upon for, tax, legal, investment or accounting advice. You should consult your own tax, legal, investment and accounting advisors before engaging in any transaction.
Get the report

Read More
Insights
Research to help you make knowledgeable investment decisions