Searching for clarity in the capital markets during the pandemic
Jeff DeHarty authors article featured in July/August issue of Colorado Real Estate Journal.
The disruption within the capital markets during the COVID-19 pandemic has provided significant uncertainty for borrowers looking to capitalize commercial real estate projects. However, recent trends reflect a return of capital and transaction volume for the remainder of 2020. Understanding which capital market participants are actively transacting, how debt structures are impacted and whether distressed opportunities will surface are important factors to consider as we navigate an uncertain economic recovery.
Prior to looking forward though, it is important to reflect on the unprecedented but necessary actions that the Federal Reserve has taken in an effort to keep liquidity in the capital markets. Through a variety of tools and facilities, the Federal Reserve has pumped over $2.6 trillion into the markets. In conjunction with Congress’ approval of the $2.2 trillion Coronavirus Aid, Relief, and Economic Security Act, our central bank balance sheet has ballooned by $4.8 trillion since the start of the pandemic.
While the intent of these extraordinary measures has been to support our economy and encourage lending, the profiles of lenders who are actively transacting vary widely. Many banks found themselves resource constrained with administering and deploying Paycheck Protection Program funds across thousands of applicants. Due to this, some banks temporarily pulled back from commercial real estate lending. Banks that remain active are more aggressive for existing clients or those new clients who are willing to bring along a greater depository relationship. In our current environment, banks simply are not interested in transacting just to transact. Loan committees are requiring greater levels of recourse throughout and are pulling back 5 to 10% on leverage, especially for construction financing.
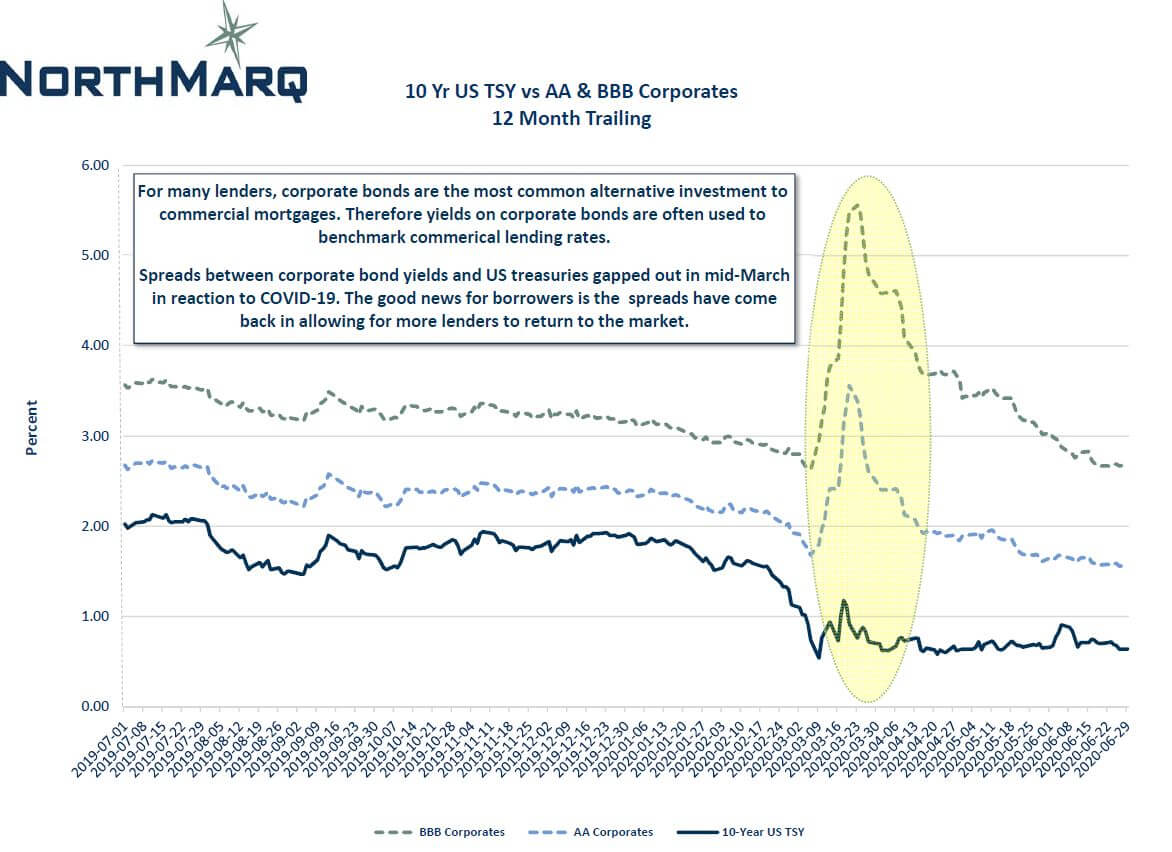
While some life insurance companies remained active during the early stages of the pandemic, many chief investment officers chose to reallocate investment dollars from commercial real estate mortgages and into corporate bonds as corporate bonds spreads widened considerably for a period of time. (See graph for context.) As the capital markets have settled, we are encouraged to see many life insurance companies return. Not by accident, the historically conservative underwriting approach of life insurance companies has created a margin of safety within their commercial real estate loan portfolios. These healthy balance sheets allow life insurance companies the capabilities to remain active and even situationally aggressive under stressed economic conditions. Recently reduced floor rates tend to be in the 2.85 to 3.25% range. With a flat yield curve, longer-term debt still is very attractive. Multifamily and industrial assets remain the preferred assets classes, with maximum leverage generally topping out at around 65% loan to value. Expect life insurance companies to be a pricing leader, not a leverage leader.
As the pandemic began to take hold and bonds spreads widened across all capital market products, the Federal Reserve stepped in and pledged to continually purchase agency mortgage-backed bonds. This move solidified the backstop for Fannie Mae, Freddie Mac and Federal Housing Administration-backed bonds and underscores the nature and extent of capital availability for the multifamily sector. As such, multifamily financings continued throughout the height of early pandemic uncertainty. Reserve requirements for debt service shortfalls are loosening, but these structures likely will remain for higher leverage loans for the remainder of the year. Agency spreads have continued to tighten and even if you bump against an index floor, all-in fixed rate coupons still are in the 2.75 to 3.25% range for 10-year loans. Borrowers looking for sub-2.5% coupons and greater prepayment flexibility have found floating rate debt attractive. Maximum leverage loans offered via Federal Housing Administration/Housing and Urban Development executions have led to a surge in pipeline volumes for 221d4 construction/perm loans and 223f refinance loans. These loan volume increases also can be partially attributed to banks pulling back on construction financing leverage and recent changes of the stabilized seasoning requirements for 223f refinances. Historically, when credit tightens, FHA/HUD loan executions become more appealing for developers and investors.
The impact of constricted capital flow was likely felt most abruptly by commercial mortgage-backed security lenders and debt funds. These lenders primarily rely on an ability to recycle capital via securitized loan executions. Without assurances from a “B” piece bond investor at acceptable bid-ask levels, new issuance CMBS effectively froze for 45 days. That said, recent encouraging trends for CMBS lenders and debt funds have surfaced in the form of successful securitizations of new issuance CMBS and CRE collateralized loan obligation bonds. This has allowed these lenders to quote and close new loans across the widest array of asset types. CMBS spreads currently range from 300 to 350 basis points, over the corresponding Swap index. Many debt funds leverage returns by funding bridge loans from a warehouse line of credit prior to packaging as CRE CLO bonds. Warehouse facilities are governed by various covenants requiring liquidity and leverage ratios to be maintained. If these covenants are breached, cash margin calls and repurchase agreements are forced upon the debt funds in order to maintain compliance. Few debt funds are unleveraged, but those that can lend from their balance sheet are still pricing spreads about 100 to 175 basis points wide from precoronavirus levels.
Understanding how various lenders are structuring debt is important for developers and investors as they strategically look at their own business models and consider how to take advantage of distressed opportunities. Just as capital availability varies by asset type, the pandemic effects on commercial real estate depends on asset type. With most lenders temporarily pulling back on hotel and retail loan originations, it is vital that a healthy CMBS and CRE CLO market function, providing capital to these assets through transition and stabilization. The disproportionately negative effect on hotel and retail assets already is surfacing in the form of delinquent volume. According to Trepp, 21% of hotel CMBS loans and 15% of retail CMBS loans are 30-plus days delinquent. Collectively, this amounts to over $40 billion in unpaid principal balance exposure. As delinquent loans are transferred to special servicing and regulators remain lax in risk-based capital enforcement, expect a timing lag before seeing significant note sale volume.
We are in a recession and hopefully a “V” recovery is possible. Stay cautiously optimistic as the pandemic has driven the economy into a recession, not the lack of sound underwriting of commercial real estate assets. Whatever your outlook, expect the cost of capital to remain low for the foreseeable future. Treasury yields for three-, five- and seven-year notes each hit record lows and Fed Chairman Jerome Powell stated at the June FOMC meeting, “We’re not even thinking about thinking about raising rates.” At least we have clarity on interest rates.
Related Contacts

Northmarq is a full-service capital markets resource for commercial real estate investors, offering seamless collaboration with top experts in debt, equity, investment sales, loan servicing, and fund management. The company combines industry-leading capabilities with a flexible structure, enabling its national team of experienced professionals to create innovative solutions for clients. Northmarq's solid foundation and entrepreneurial approach have built an annual transaction volume of more than $39 billion and a loan servicing portfolio of more than $76 billion. Through the 2022 acquisition of Stan Johnson Company and Four Pillars Capital Markets, Northmarq established itself as a provider of opportunities across all major asset classes. For more information, visit: www.northmarq.com.