
San Diego multifamily sales accelerated in the third quarter
Q3 2026
Download the full Q3 2026 San Diego multifamily report here.
Highlights:
- Property performance in the San Diego multifamily market was mixed during the third quarter, with rents continuing to rise while the vacancy rate increased. Inventory growth remains elevated, with over 4,600 units completed so far this year.
- The vacancy rate ticked higher during the third quarter, rising 20 basis points to 5.2%. In the past 12 months, the vacancy rate has increased by 60 basis points.
- Asking rents continued to tick higher in recent months, rising by 0.3% to $2,621 per month. Year over year, asking rents have increased by 1.2%.
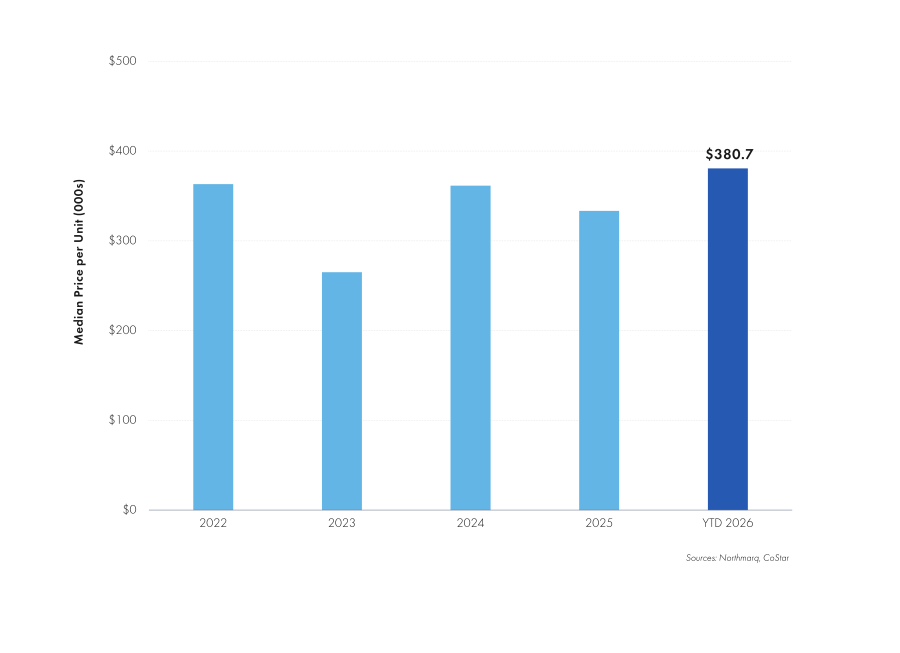
- Investment activity accelerated during the third quarter, bringing the year-to-date transaction count back in line with last year. The median sale price at this point in the year is $380,700 per unit, up from $333,300 per unit last year.
San Diego multifamily market overview:
The elevated pace of completions in San Diego continues to drive changes in multifamily operating conditions. Absorption has picked up in recent months, but net move-ins have lagged the number of new units being delivered, pushing vacancy higher. This rise in vacancy is much more pronounced in Class A product. In Class B and Class C apartments, the vacancy rate has only risen 10 basis points in the past year, now at 3.3%. On the other hand, rent growth has been primarily driven by newer and higher-tiered assets, while Class B and Class C rents have been much slower to rise. Changes in operating conditions also varied widely by location. The North Beaches were the best-performing areas overall, with vacancy decreasing by 60 basis points while rents increased by 3.4% in the past 12 months.
The third quarter was the most active quarter of the year for multifamily sales activity. In the past three months alone, there were roughly as many transactions as there were during the entire first half of the year. Many of the transactions have been large Class A and Class B properties averaging nearly 250 units each, with a handful of these achieving especially high pricing. Class A pricing varied widely, ranging from the low-$400,000s to the mid-$800,000s per unit. Additionally, a handful of Class B assets sold for Class A pricing primarily due to their prime locations in coastal submarkets. Lower-tier properties were the only ones to record a decline in pricing this year, down 10% to a median price of $224,600 per unit. These properties tended to contain fewer units and were primarily located in more affordable areas, such as El Cajon and Escondido.
Employment:
Total employment increased by 1.0%, adding 14,800 workers.
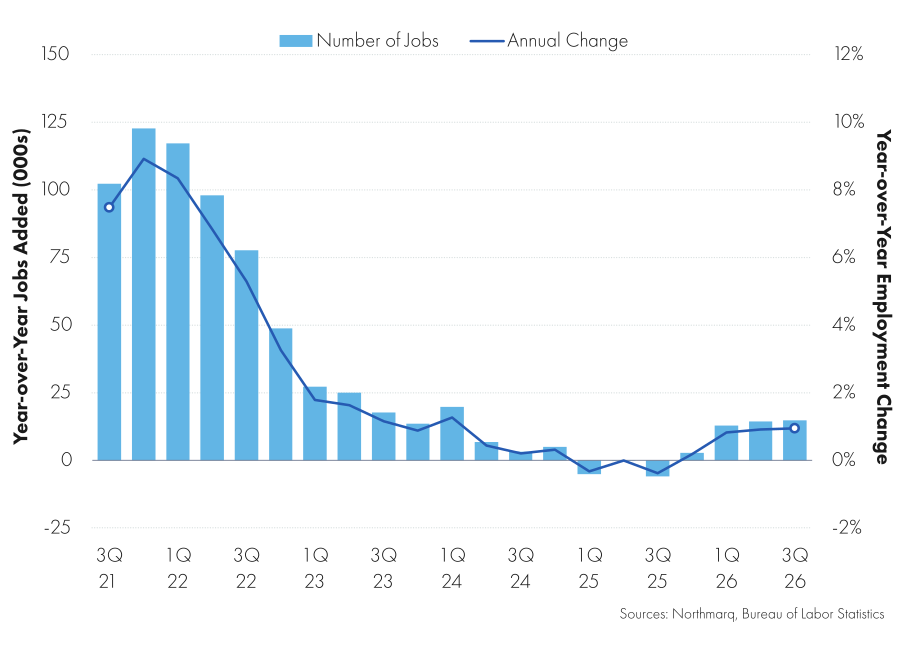
- Employment growth has resumed in recent periods. Throughout the past 12 months, total employment in San Diego has increased by 1.0%, with the addition of 14,800 workers to local payrolls.
- Retail employment posted its strongest annual gain since 2022. In the past 12 months, retailers expanded payrolls by 0.9%, bringing on 1,200 new employees.
- Leisure and hospitality employment has continued to expand in San Diego in recent periods. During the past 12 months, the sector has added 5,500 net new jobs, a growth rate of 2.6%. More than 13,000 leisure and hospitality jobs have been added in San Diego since the beginning of 2024.
- Forecast: The current pace of employment growth is expected to continue throughout the remainder of the year. In 2026, total employment in San Diego is expected to expand by 1.0%, with the addition of roughly 15,000 positions.
Development and permitting:
Roughly 8,900 units are under construction.
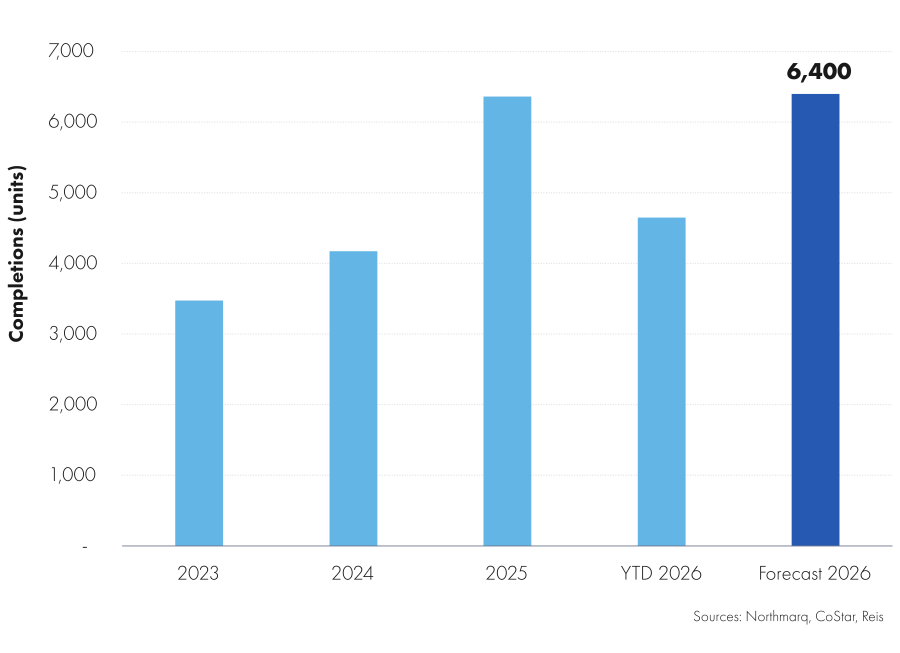
- Total completions at this point in the year are ahead of last year’s pace. More than 4,600 units have delivered in San Diego year to date, up from roughly 4,300 units during the same period in 2025.
- New projects have broken ground at roughly the same pace that others are delivering. Projects totaling roughly 8,900 units are under construction, closely tracking levels recorded one year ago.
- Permitting has slowed in recent periods. Year to date, there have been permits issued for projects totaling 3,800 multifamily units. At the same point in 2025, permits had been issued for projects totaling over 5,500 units.
- Forecast: Annual deliveries are forecast to roughly match 2025, with approximately 6,400 units on track for completion this year. In the trailing five years, developers completed an average of 3,900 units per year.
Vacancy:
Absorption strengthened in recent months.
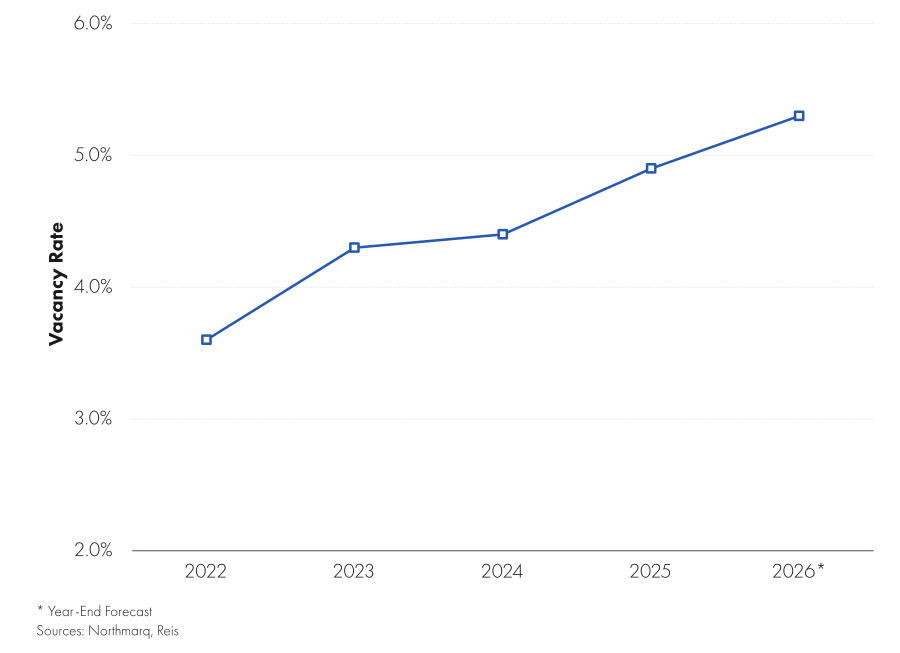
- After going unchanged in the second quarter, apartment vacancy in San Diego ticked higher during the third quarter, rising 20 basis points to 5.2%. Year over year, the vacancy rate has risen 60 basis points.
- The Mira Mesa/Rancho Bernardo submarket remains the leading major submarket for vacancy improvement. The vacancy rate in this area decreased by 80 basis points in the past 12 months to 5.2%.
- Absorption strengthened in recent months. Year to date, there have been more than 2,500 net move-ins in San Diego, up from roughly 2,200 by the same point in 2025. In the past 12 months, net absorption totaled nearly 4,200 units.
- Forecast: As absorption continues to trail the pace of deliveries, vacancy is expected to keep inching higher during the fourth quarter. In 2026, the vacancy rate is forecast to rise by 40 basis points, ending the year at 5.3%.
Rents:
The North Beaches submarket leads rent growth.
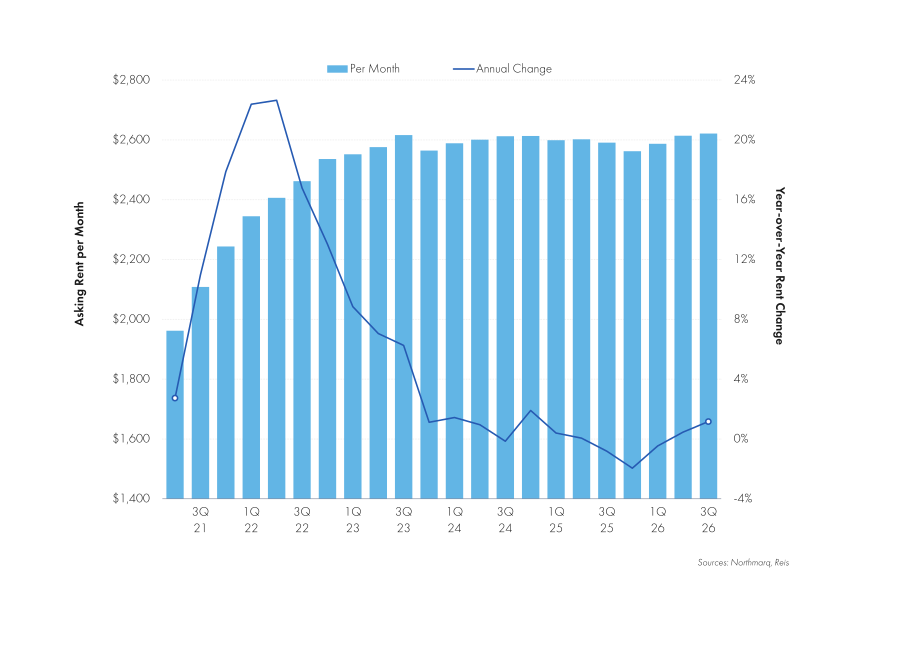
- Asking rents in San Diego increased in the third quarter, though at a slower pace than in recent periods. During the past three months, asking rents rose 0.3% to $2,621 per month. Year over year, rents are up 1.2%.
- The North Beaches submarket, extending from Del Mar to Carlsbad, is the current leader in rent growth. During the past 12 months, asking rents in this area have increased by 3.4% to $3,215 per month.
- The Balboa Park submarket, encompassing neighborhoods such as Hillcrest and University Heights, has recorded accelerated rent growth supported by a wave of new development and increased renter demand. Rents here have advanced 2.9% in the past year to $2,435 per month.
- Forecast: Asking rents are projected to continue rising at a modest pace in the fourth quarter. By the end of the year, rents are forecast to reach roughly $2,625 per month, a 2.5% annual increase.
Multifamily sales:
The median sale price is up 14% from 2025.
- There have been roughly the same number of multifamily transactions in San Diego during the first three quarters of this year as there were during the same period in 2025. This places activity levels within range of the 2010-2019 averages for this market.
- Pricing remains elevated. Year to date, the median sale price in San Diego has increased by 14% from 2025 to $380,700 per unit. Compared to the previous annual peak recorded in 2022, current pricing is up 5%.
- Cap rates in San Diego remained within the range recorded since 2023. Year to date, the average cap rate is 5.0%, with properties trading from the mid-4% to low-6% range.
Looking ahead for San Diego:
Operating conditions in San Diego are expected to continue along their current trajectory during the fourth quarter as they did in the third quarter. Overall market vacancy should tick slightly higher again to close the year. While this will mark the highest vacancy rate that San Diego has recorded in decades, it remains tight compared to national averages and is expected to decline modestly in the coming year. Rent growth may slow in 2027 in response to the rise in vacancy, though it should remain positive throughout the remainder of this year. The submarkets that have been leading in rent growth are expected to maintain their positions through the end of 2026, while vacancy improvements will likely remain limited to only a handful of submarkets. Employment trends may begin to have a more noticeable effect on the market, with even modest job growth sustaining recent absorption levels.
Multifamily investment sales activity in the fourth quarter is expected to track the previous few months, with only a few small changes forecast for the remainder of the year. There will likely be an uptick in the number of transactions that take place in the Chula Vista/Imperial Beach and Balboa Park areas, but Downtown San Diego should remain the leading area for activity. Class A properties are expected to continue to trade, though the share of total activity that these properties account for may taper. Class A properties have made up a quarter of all transactions at this point in the year, well above their average 15% share of sales over the past five years. Some sellers have opted to divest due to rising regulatory costs. While this trend has been more pronounced in nearby Los Angeles, it has become an increasingly important factor in San Diego as well.
Connect with our San Diego team today
For a complete analysis of supply, demand, vacancy, rent and investment trends in the San Diego multifamily market, download and read the full report below. Subscribe to receive the latest multifamily market insights and research.
The Northmarq San Diego office provides a broad range of commercial real estate solutions across debt, equity and investment sales. Engage with our San Diego team today.
Get the Q3 San Diego report


Insights
Research to help you make knowledgeable investment decisions